SaaS Portfolio Intelligence (SPI)
Keep every SaaS product live, secure, scalable and profitable
SaaS Sentinel brings together operational monitoring, security and compliance oversight, cost analysis and capacity planning in one platform.
Move beyond knowing whether your applications are running. Understand what they cost, how efficiently they operate, when they need to scale and how those decisions affect profitability.
Built for apps made with Lovable and Supabase.
14-day free trial with no card required, then from £18 a month for your first 5 projects.
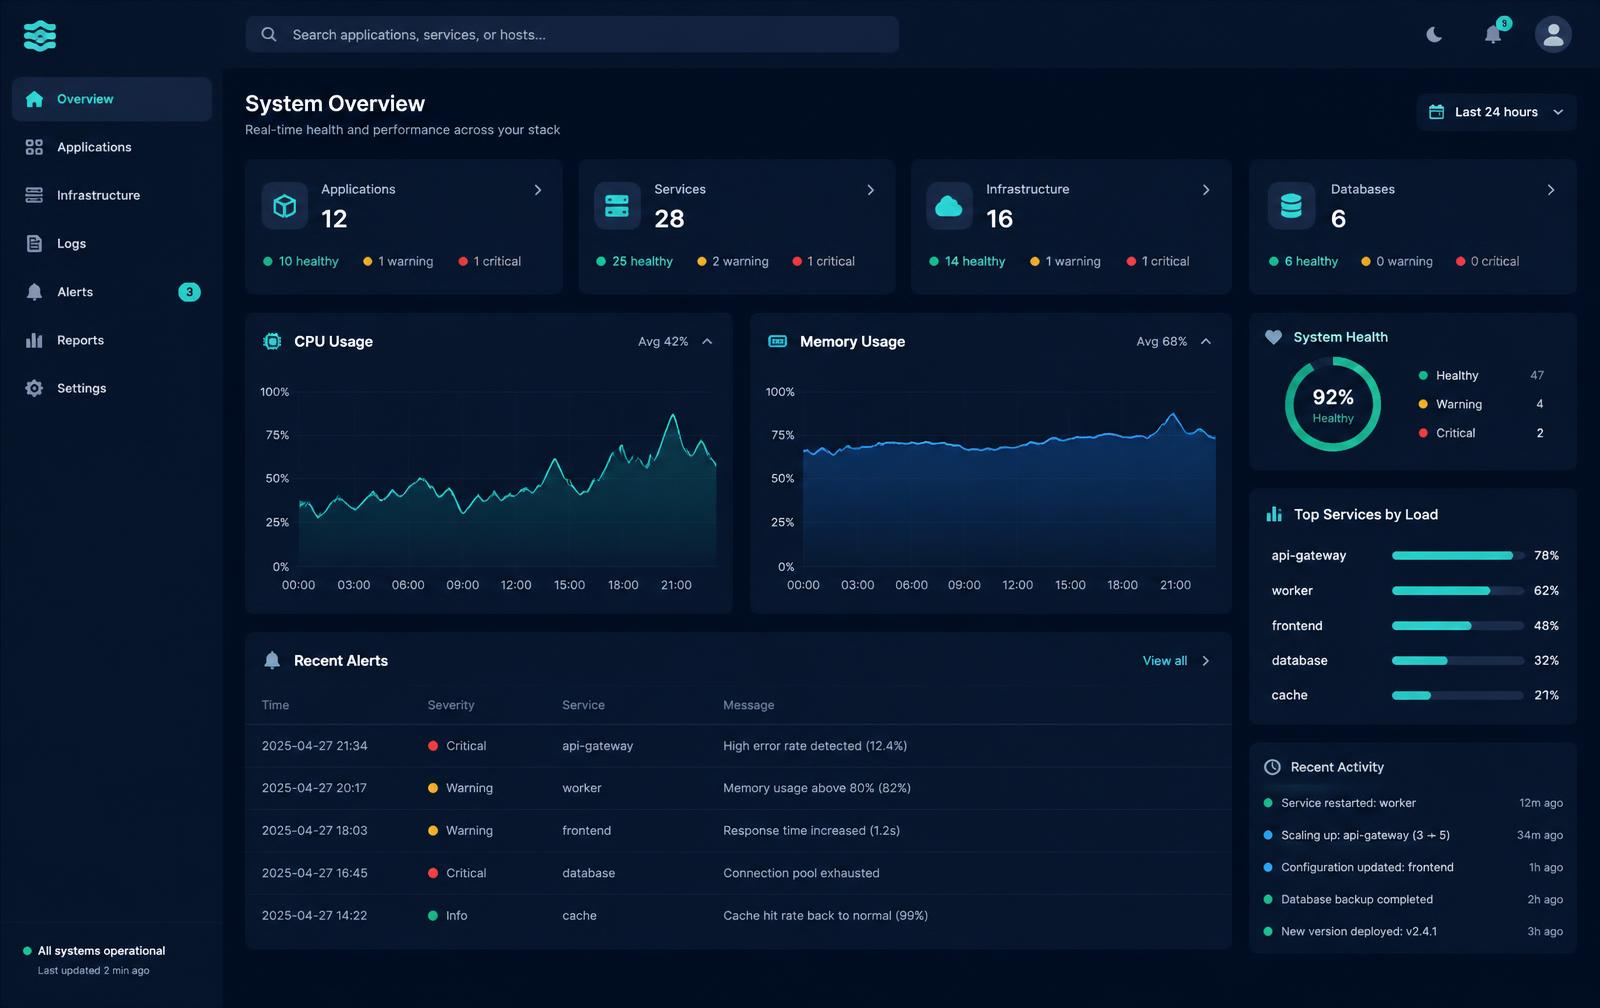
The SaaS Portfolio Intelligence Platform
The four pillars of SPI
SaaS Portfolio Intelligence (SPI) means managing your apps as one portfolio, not a collection of separate dashboards. SaaS Sentinel covers all four pillars.
What is SaaS Portfolio Intelligence?
Operational performance
Uptime, response times, database health, error logs and publishes for every app.
Learn moreSecurity and compliance
Security advisories, vulnerable packages, findings and a risk register with an audit trail.
Learn moreCost and profitability
Running costs per app, cost per licence, break-even and margin per customer.
Learn moreCapacity and growth
Weekly capacity reviews that tell you when a project needs to scale, and what it would cost.
Learn moreOperational performance · Made for Lovable
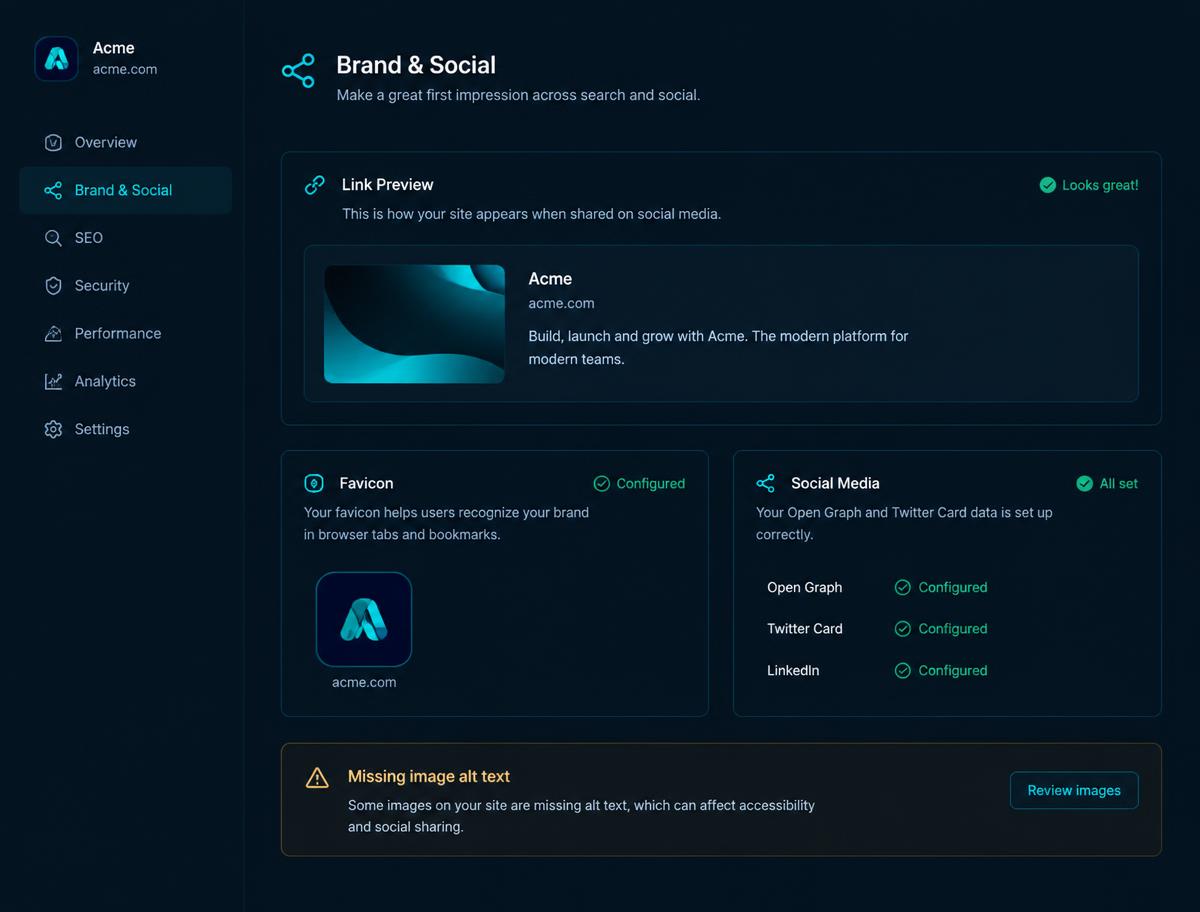
Never ship a Lovable app that still looks like a template
Every day SaaS Sentinel reads each app's home page and sharing tags, and tells you the moment a default Lovable title, preview image or favicon slips through.
- Last publish date for every app, with stale-publish warnings
- Each publish shown as a release event on your health charts — add version numbers
- Page title, description, sharing image, favicon, sitemap and robots checks
- Build and credit spend counted in your running costs
Operational performance · Supabase
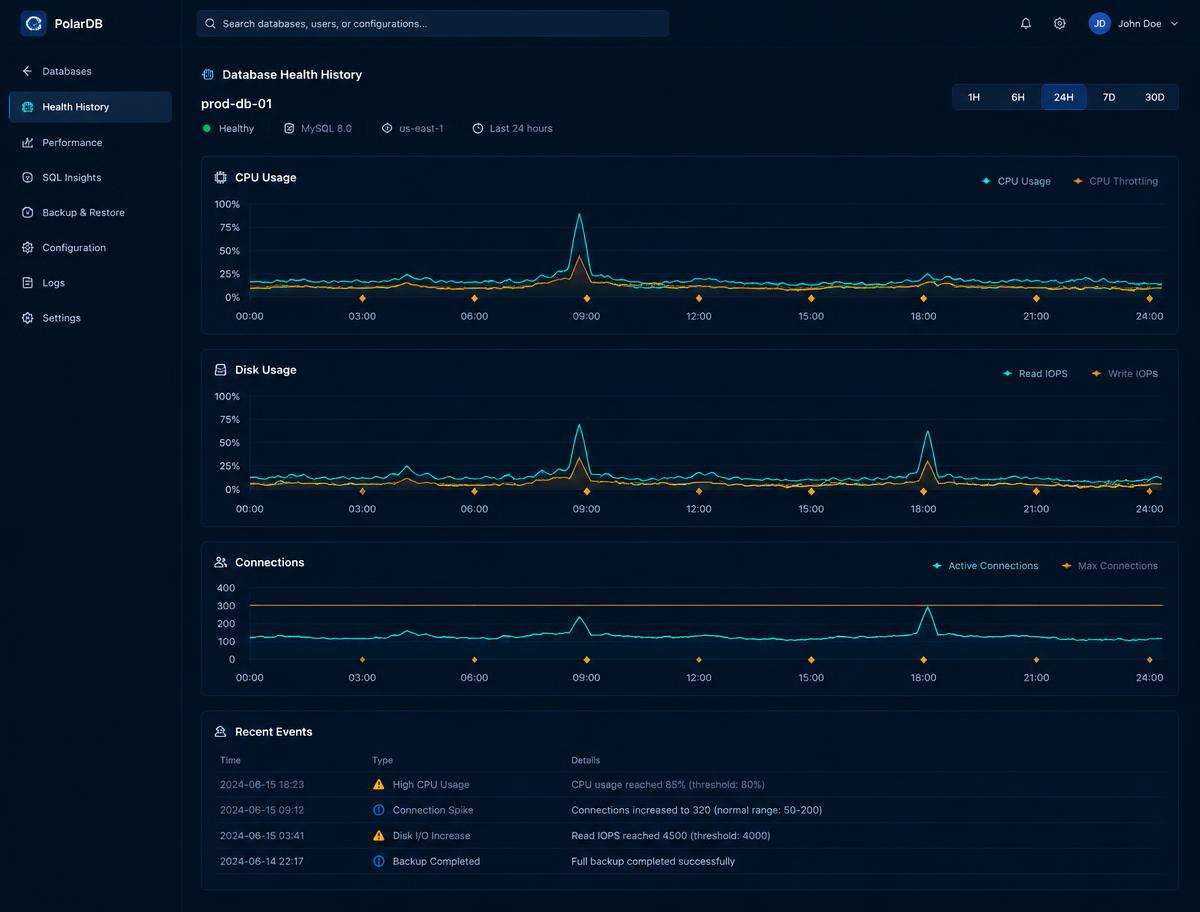
See trouble in your database before your customers do
Checks every 15 minutes, with history charts that show exactly when a release changed things.
- CPU, memory, disk and connections with warning and critical limits
- Error logs gathered from every Supabase source, grouped and searchable
- Backup health, new Postgres versions and security advisories
- Alerts that clear themselves once things recover
Cost and profitability
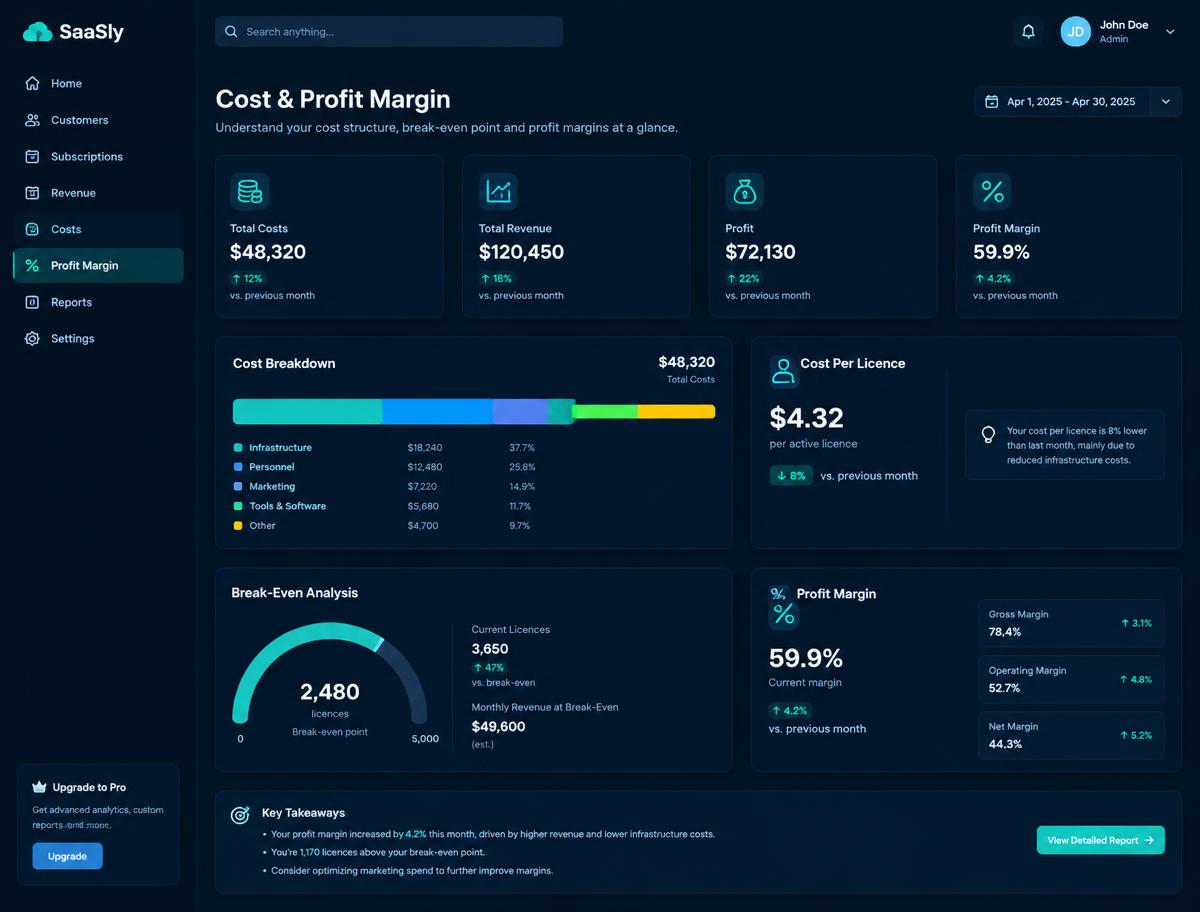
Turn your stack bill into profit per customer
Database, email, AI, build and hosting costs combined with your pricing, in any currency.
- Cost per licence for every app and customer
- Break-even point and profit margin at a glance
- Daily exchange rates for mixed-currency billing
Website checks
Uptime and response time for every app, every 15 minutes.
Code safety
Daily checks of your GitHub code for packages with known security problems.
Built for agencies
Keep each customer separate, with roles from owner to read-only.
Private by design
Credentials and personal data encrypted; every change recorded in an audit trail.
Up and running in minutes
Sign in
Google or Microsoft, no passwords. MFA optional, chosen per organisation.
Connect
Import your Supabase projects and link each app's GitHub repo.
Relax
Get alerts, health, branding and margin for every app, automatically.
From operational visibility to informed business decisions.
Keep your SaaS portfolio live, secure, scalable and profitable. Start with a 14-day free trial — no card needed, and MFA stays optional per organisation.